Our trade grades are calibrated and unbiased — and they still can't tell you who will win a trade, because trades are an efficient market and ~92% of the outcome is unforeseeable at the time.
Every player in a deal gets an expected value — what he was projected to produce at the moment of the trade, in WAR and in surplus dollars (a Bayesian blend of pedigree and recent form over his years of team control). We then track what he actually produced for his new club. The "who won" verdict is the realized side — it is descriptive, not a skill claim.
Surplus = production value − salary. The question is how to price production value in dollars. The simple answer is "multiply WAR by the league-average FA price" (~$8M/WAR). The better answer — and what we use — is tier-adjusted: WAR delivered by a star is empirically worth more than WAR delivered by a role player.
The reason is the FA market is segmented. Calibrating on 200+ FA signings (Spotrac, 2020-26) using AAV/projected-θ at signing:
| Projected θ (WAR/yr) | n | Median AAV | Implied $/WAR | Multiplier on the $8M base |
|---|---|---|---|---|
| < 1.5 — replacement-level / depth | 91 | $6M | ~$5M | 0.65× |
| 1.5 – 2.5 — role player | 19 | $16M | ~$7M | 0.95× |
| 2.5 – 3.5 — above-average everyday | 36 | $28M | ~$10M | 1.25× |
| 3.5 – 5.0 — star | 9 | $40M | ~$11M | 1.40× |
| 5.0+ — superstar | 2 | $60M | ~$13M | 1.60× |
Stars get a real scarcity premium per WAR — there are ~5 of them on the FA market in any given offseason, and the bidding pushes their per-WAR rate well above the league baseline. Replacement-level FA vets, by contrast, anchor at the low end because the supply is deep.
Concretely: a 4-WAR star's expected production prices at 4 × $8M × 1.40 = $45M/year, while a 1-WAR depth piece prices at $5M/year. Cost-controlled stars (Skenes, Caminero, Chourio) now carry larger surplus because their cheap WAR is valued at the elite tier; mega-contracts (Soto, Judge) grade less brutally negative than under the flat-$8M model because the elite WAR they deliver is genuinely worth more.
Salary is still in nominal dollars, era-neutralized via that season's league-average $/WAR. So you can compare a 1985 trade to a 2025 trade directly — both end up scaled into today's-dollar equivalent value.
The tier table above is calibrated on all roles pooled together — reasonable for hitters, where θ (expected WAR/yr) is directly comparable across positions. It breaks for relief pitchers: a dominant closer's θ tops out around 0.5-1.5 simply because he throws 60-70 innings a year, not because he's replacement-level talent. Priced off the pooled curve, elite closers were landing in the "replacement" or "role player" tier — visibly wrong next to what the free-agent market actually pays them. Same directional issue, smaller, for starters (more innings than a pooled curve gives them credit for) and a mirror-image effect for catchers and infielders (the pooled curve slightly over-credits their θ relative to what the market pays).
Checked the same way as the tier table — 232 FA signings (2019-26), actual AAV vs. what the pooled curve alone would have predicted for that signing, split by role, empirical-Bayes shrunk toward "no adjustment" by sample size so a handful of DH or 2B contracts can't overfit the correction:
| Role | n | Correction on top of the tier table |
|---|---|---|
| Closer | 16 | 2.06× |
| Starting pitcher | 53 | 1.56× |
| Outfield | 29 | 1.28× |
| DH | 7 | 1.07× |
| Reliever (non-closer) | 66 | 1.03× (essentially no change) |
| Shortstop | 13 | 0.94× |
| Third base | 11 | 0.89× |
| Second base | 7 | 0.86× |
| First base | 14 | 0.86× |
| Catcher | 16 | 0.80× |
The closer/reliever split matters: lumping all relievers together makes it look like every reliever is underpriced, when it's specifically the closer role commanding the premium — a setup-man with the same θ as a closer doesn't get paid like one, and shouldn't be priced like one either. The correction only applies once a player has a real, games-evidenced role — an unproven pitching prospect with zero MLB innings is priced off the tier table alone, not defaulted into the starter premium just because he hasn't been used in relief yet.
Measured on 7,387 acquired players in settled trades (1985–2018):
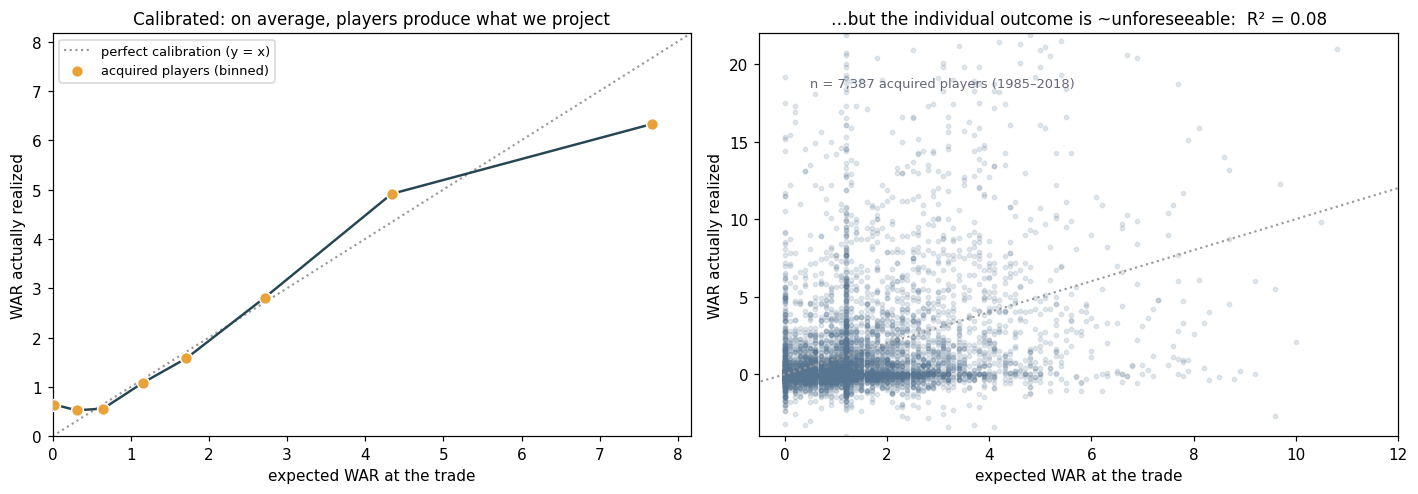
The left panel is the good news: bin acquired players by what we projected, and the average realized value lands right on the \(y=x\) line. The right panel is the catch — the very same data, one dot per player.
Those unbiased projections explain almost none of the individual outcome: the correlation between expected and realized WAR is just 0.29 (R² = 0.08). And the bottom line for a whole deal — does the side our model projected to win actually end up ahead? — is 53%, a coin flip with a thumb barely on the scale.
That is not a defect to engineer away. Roughly 92% of a trade's outcome is unforeseeable at the time: injuries, development curves, regression to the mean, role and park changes, a swing-plane tweak in a new org. A good model prices the bet correctly and quantifies the variance honestly. It does not pretend to a foresight that does not exist.
This should be uncomfortable for anyone selling trade "grades" as verdicts. A completed trade is a two-sided agreement: two front offices looked at the same players and each decided its side was worth doing. When two informed parties clear at a price, that price is — almost by construction — fair; the realized winner is then chosen mostly by chance.
And front offices hold vastly more information than the public ever will — full medicals, proprietary scouting and biomechanics, internal projections, makeup reports. If anyone could systematically beat the trade market, it would be them. They can't, and we can show it with their own track records:
This is the efficient-market hypothesis applied to a baseball trade desk: in a market whose participants are this resourced and this motivated, prices are fair and edges get arbitraged away. What's left over — the part that decides who "won" — is variance. The market always wins.
In short: we can give you the odds and price the chips correctly. We can't — and neither can anyone, including the people holding the medicals — tell you which way the wheel lands. That's not our limitation; it's the market's.
Fit on full team-seasons (≥100 games), 1985–2024/25. All figures are franchise-level outcomes credited to the decision-maker in the relevant year — see the GM profiles for per-executive numbers.