Build trades, evaluate GMs, and visualize the economics of baseball.
Build any hypothetical MLB trade — drop in players from any roster, add cash, and get each side's expected surplus and WAR from the Bayesian model that grades every real trade since 1985.
Trade Calculator →Or look up a real one: BOS won the biggest deal of 2026 by +$4M →
Wins/season above a replacement GM — an average front office on the same budget — org-adjusted & shrunk. How it's built →
| Executive | Teams | Yrs | GM WAR | Titles | |
|---|---|---|---|---|---|
| 1 | Andrew Friedman | 21 | +9.3 | 3 | |
| 2 | Erik Neander | 10 | +9.1 | 0 | |
| 3 | Brandon Gomes | 5 | +5.9 | 2 | |
| 4 | Mike Chernoff | 11 | +5.9 | 0 | |
| 5 | Matt Arnold | 6 | +4.9 | 0 | |
| 6 | Chris Antonetti | 16 | +4.2 | 0 |
All 30 front offices in one view — who runs each team, total payroll, the year-over-year spend change, competitive regime, record & postseason — for any year since 1985. Leading 2026 so far:
| Team | Head of baseball ops | Regime | Record | Payroll | Δ Pay | |
|---|---|---|---|---|---|---|
| 1 | Andrew Friedman | CONTEND | 65–38 | $350M | +18M | |
| 2 | Matt Arnold | WINDOW | 64–38 | $113M | +5M | |
| 3 | Alex Anthopoulos | FORCED-SPEND | 60–42 | $226M | +37M | |
| 4 | Erik Neander | WINDOW | 59–43 | $74M | +13M | |
| 5 | Brian Cashman | CONTEND | 57–45 | $272M | +26M | |
| 6 | Jed Hoyer | CONTEND | 57–45 | $212M | +11M |
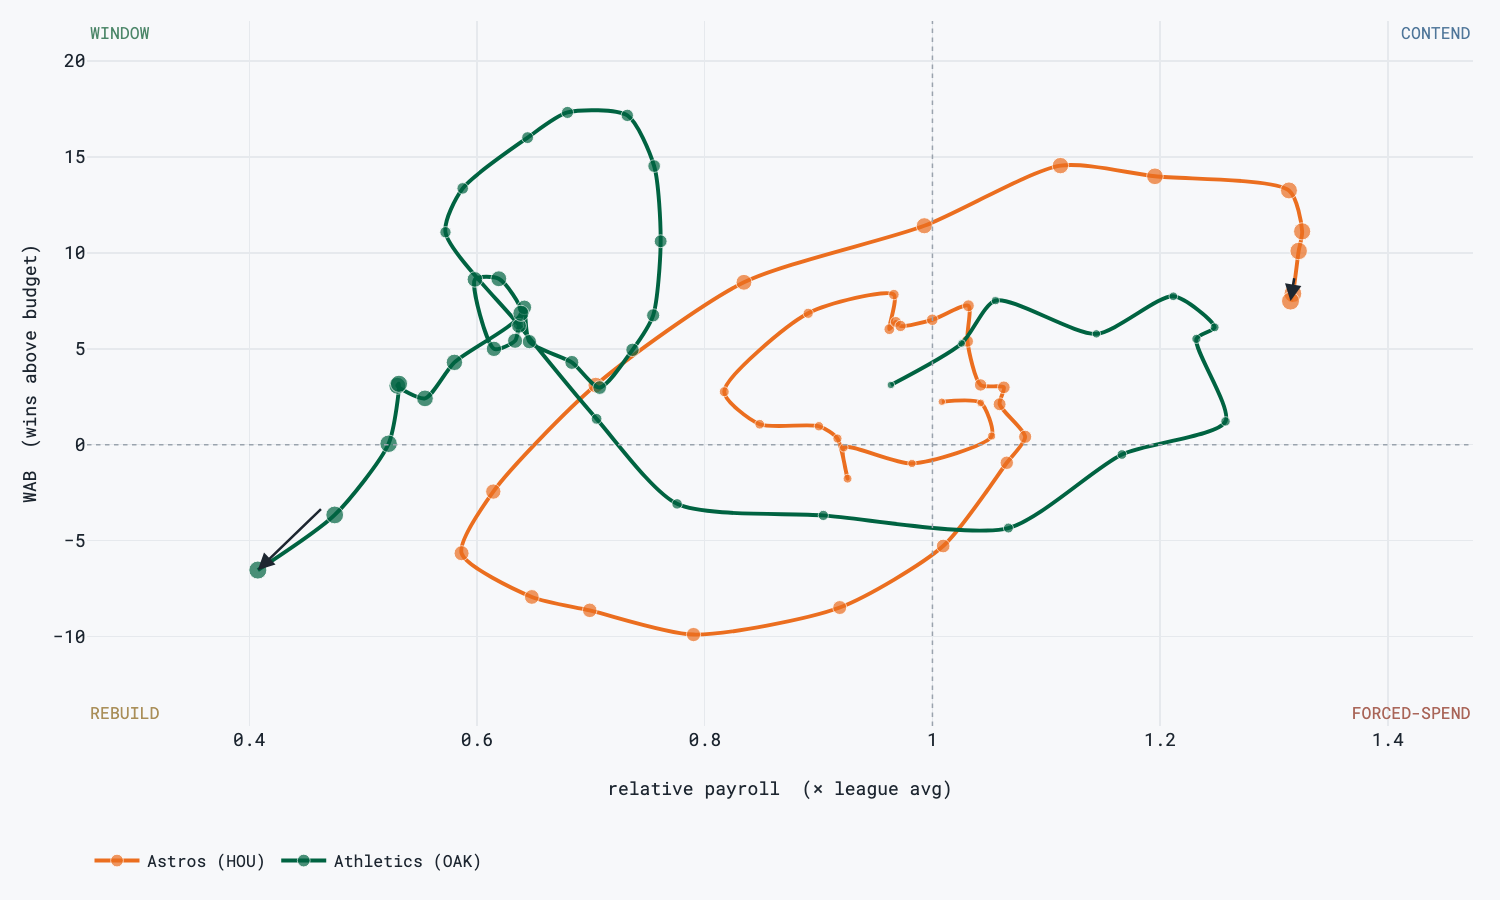
Every team's competitive story, traced from the data.
Career org-adjusted skill — the headline number, over a full tenure. How it's built →
| Executive | Teams | Seasons | GM WAR | Titles | |
|---|---|---|---|---|---|
| 1 | Andrew Friedman | LAD TBR | 21 | +9.3 | 3 |
| 2 | Erik Neander | TBR | 10 | +9.1 | 0 |
| 3 | Pat Gillick | BAL PHI SEA TOR | 20 | +7.0 | 3 |
| 4 | John Schuerholz | ATL KCR | 23 | +6.5 | 2 |
| 5 | Brandon Gomes | LAD | 5 | +5.9 | 2 |
| 6 | Jeff Luhnow | HOU | 9 | +5.9 | 1 |
Draft Value Over Slot: career fWAR each pick produced above what its draft slot historically returns. Hit DVOS (drafting position players above slot) is the reliable position skill.
| Scouting Director | Teams | Drafts | DVOS | Hit DVOS | |
|---|---|---|---|---|---|
| 1 | Roy Clark | ATL | 10 | +194.2 | +204.5 |
| 2 | Mike Arbuckle | PHI | 8 | +148.8 | +188.1 |
| 3 | Brian Sabean | NYY SFG | 6 | +133.5 | +107.7 |
| 4 | Logan White | LAD | 7 | +130.8 | +118.8 |
| 5 | John Barr | BAL NYM SFG | 11 | +129.7 | +143.1 |
| 6 | Sandy Johnson | TEX | 11 | +124.4 | +56.8 |
See the full scouting-director leaderboard →
The 10 picks whose career WAR most exceeded what their draft slot × position × age cohort historically produces. Settled cohorts only (drafts ≤ 2018). The patron saint is Mike Trout — #25 overall in 2009.

| Player | Year | Pick | Team | Pos | School | Career WAR | DVOS | |
|---|---|---|---|---|---|---|---|---|
| 1 | Albert Pujols | 1999 | #402 | IF | HS | 88 | +87 | |
| 2 | Barry Bonds | 1985 | #6 | OF | COLL | 110 | +87 | |
| 3 | Jeff Bagwell | 1989 | #109 | IF | COLL | 80 | +78 | |
| 4 | Mike Trout | 2009 | #25 | OF | HS | 85 | +77 | |
| 5 | Mike Mussina | 1990 | #20 | P | COLL | 70 | +64 | |
| 6 | Randy Johnson | 1985 | #36 | P | COLL | 66 | +63 | |
| 7 | Mookie Betts | 2011 | #172 | IF | HS | 63 | +62 | |
| 8 | Clayton Kershaw | 2006 | #7 | P | HS | 71 | +61 | |
| 9 | Mike Piazza | 1988 | #1390 | C | COLL | 59 | +59 | |
| 10 | Aaron Judge | 2013 | #32 | OF | COLL | 64 | +59 |
Every number on the site, built in the open — the model, the formula, and a worked example for each.